Complete guide to navigating and understanding the neuron type catalog
This neuron type catalog provides comprehensive information about neurons in the male-cns:v0.9 dataset. The catalog includes detailed morphological, connectivity, and functional data for each neuron type, organized into an easy-to-navigate interface.
Quick Start: Use the Types Index to browse all available neuron types, or use the search bar in the header to quickly find specific neurons.
This site is connected to neuPrint at https://neuprint.janelia.org using the male-cns:v0.9 dataset.
The main index page shows all available neuron types with filtering and search capabilities. Dropdown and text input fields are placed at the top of the page, followed by "cards" that represent a neuron type.
The filters correspond to the tag badges shown on each neuron card. Selecting a value in a dropdown filters the list accordingly.
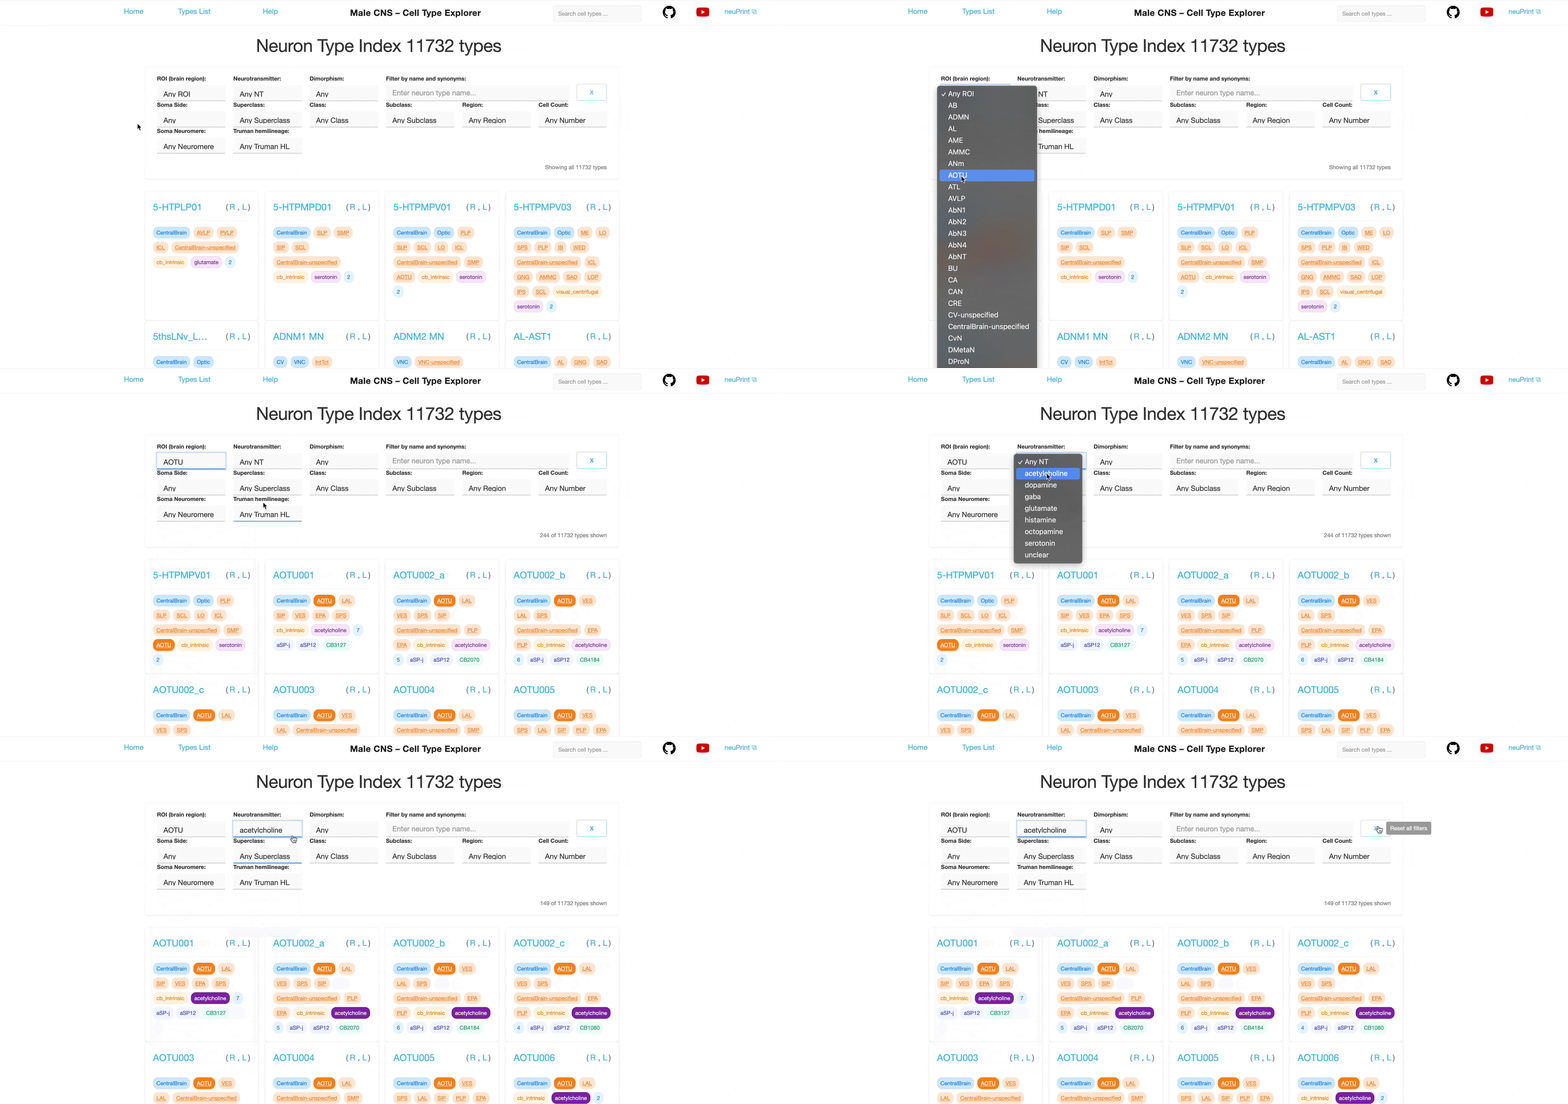
Each dropdown is single‑select. You can combine multiple different filters to further narrow the list; results satisfy all selected filters (AND logic) however each individual filter allows only one selection at a time.
For example, selecting "Glutamate" in the Neurotransmitter filter shows only neuron types that use glutamate as their primary neurotransmitter (defined in the neuPrint database). Additionally selecting "ME" in the ROI filter further narrows the list to neuron types with synapses in the Medulla.
Tip: Many tags are clickable and will filter the list to show related neuron types.
Filter by ROIs where neurons have synapses. ROIs represent brain regions; neurons are considered to be part of an ROI if they have synapses within it.
ME ROI: Brain regions such as Medulla, Calyx, or superior lateral protocerebrum.
Tip: See the neuPrint help page for a detailed list of ROIs within the database and their parent regions.
Filter by the primary neurotransmitter used by the neurons:
Acetylcholine Neurotransmitter Tags: Primary neurotransmitter used by the neurons.
The CNS dataset is based on a male fruit fly. This filter allows selection of neurons that are potentially sexually dimorphic.
Sex-specific Dimorphism Tags: Indicates sex-specific or dimorphic characteristics.
Two types of synonyms can appear on neuron cards. Use the search field to find neurons by their synonyms (see Search below). Clicking a synonym tag highlights neuron types that also have that type of synonym.
Published Synonyms Published Synonyms: Alternative names or aliases from the literature. See the neuron’s page for details on sources.
FlyWire Synonym FlyWire Type: Corresponding identifier(s) in the FlyWire dataset.
Two lateral classifications are considered for the side assignment in the dataset. One considers the location of the soma relative to the midline (`somaSide`). If the soma is missing from the reconstruction, the dendritic arbors can be used to determine the side (`rootSide`). In both cases, the majority of neurons are either considered "left" or "right", with a smaller subset classified as "middle". If a neuron is not assigned in the dataset, we classify it as "undefined".
Right, Left, Middle, and Undefined are possible values for the soma side. These badges and colors are used consistently across the site.
A high-level functional classification defined in the neuPrint database, such as Optic Lobe Intrinsic, Ascending Neuron, or VNC Motor.
Visual Superclass Tags: High-level functional classification.
Part of the same hierarchy; class groups neuron types into more specific functional groups.
Photoreceptor Class Tags: More specific functional classification within a superclass.
The most specific functional level in the hierarchy.
mechanosensory bristle Subclass Tags: Finest level of functional classification.
Region is a broader anatomical grouping that includes multiple ROIs. The hierarchy of ROIs and their assignment to regions are defined in the neuPrint database. Neurons are assigned to all regions in which they have synapses.
Optic Region: Anatomical regions such as Optic, Central Brain, Ventral Nerve Cord (VNC) or Cervical Connective (CV).
Filter by the number of individual neurons of each type. Counts are grouped for larger values.
42 Neuron Count Tags: Show the number of individual neurons of this type.
Segemental organizational unit of the fly's ventral nerve cord (VNC) based on the position of the neuronal somas.
A1 Soma Neuromere: Segemental units such as A1, CB and T2.
Groups of related neurons in the central nervous system (CNS) of the fruit fly (Drosophila), identified and categorized based on their developmental origin.
01B Truman Hemilineage: Developmental groups such as 01B, 04A and 21X.
These badges and colors are used consistently across the site.
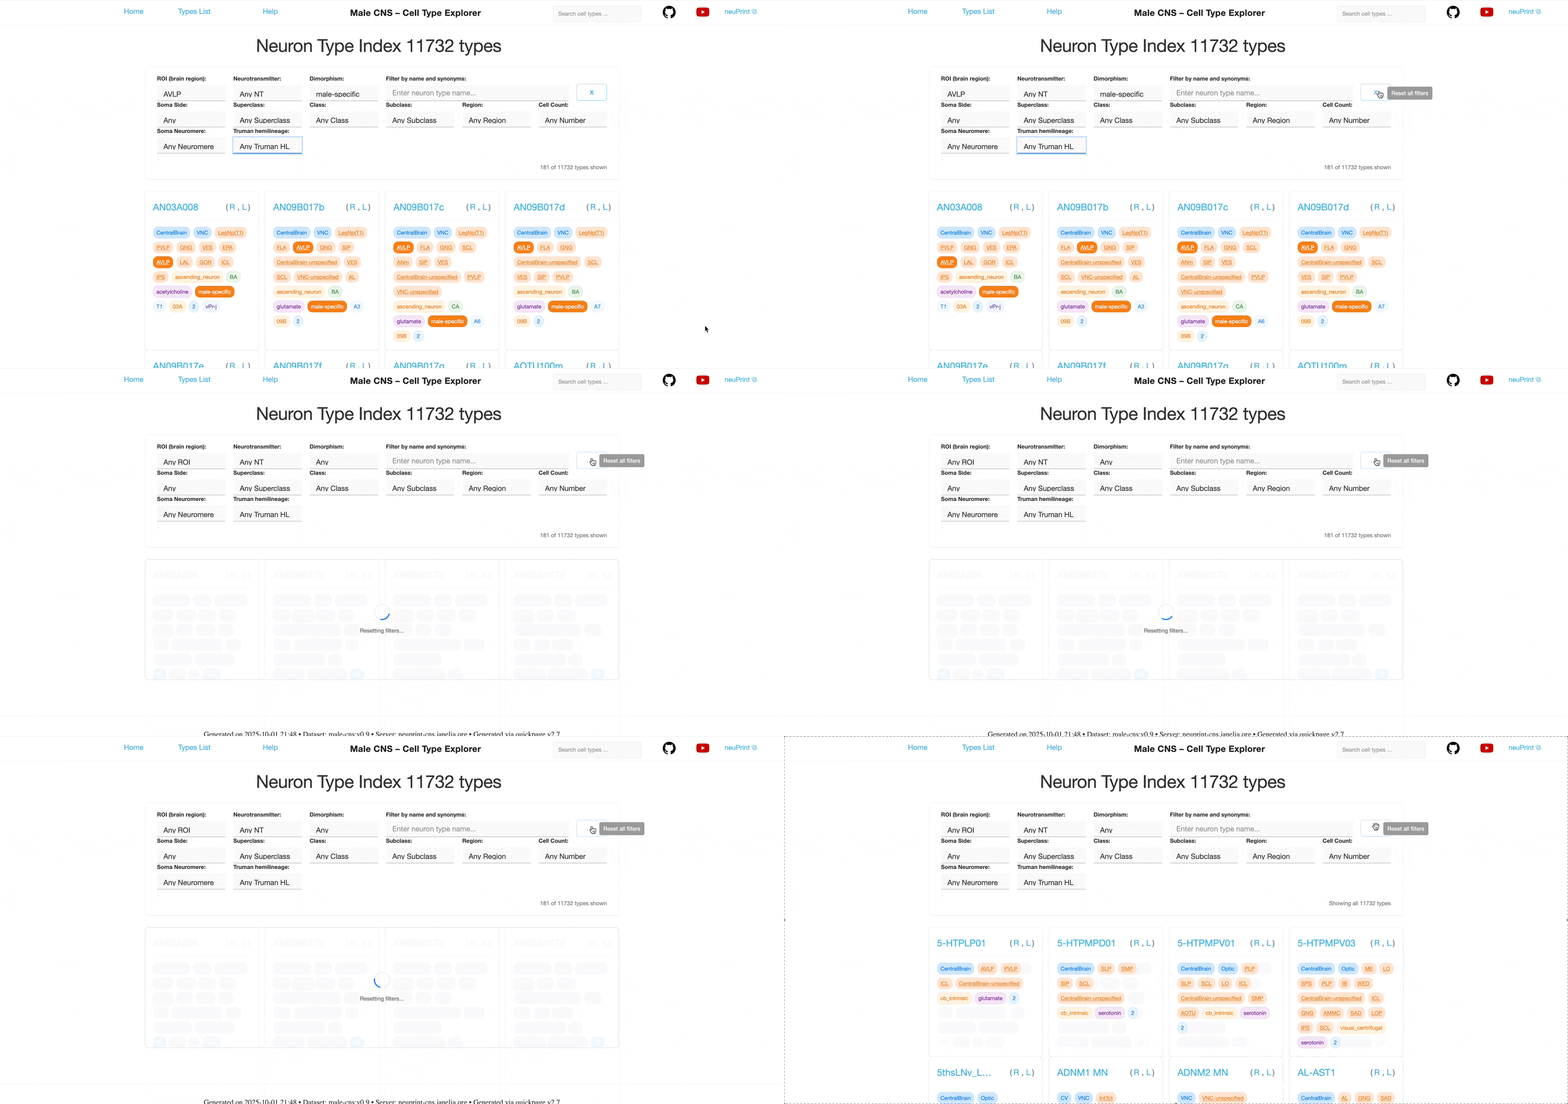
Each dropdown is single‑select. You can combine multiple different filters; results satisfy all selected filters (AND logic).
Unclick a tag to remove a single filter, clear the selections in the dropdowns or click the 'Reset all filters' button to reset the search criteria.
The search bar in the header supports type‑ahead suggestions and is case‑insensitive. Start typing a neuron name to see matches. Results may include hemisphere variants (L/R/M/C). Search also matches known synonyms as well as the cell type's corresponding name in the FlyWire Female Adult Fly Brain (FAFB) dataset. You can explore this dataset in neuPrint , the FlyWire Codex or our corresponding FAFB Cell Type Explorer .
Each neuron type has dedicated pages with comprehensive analysis and visualizations. Depending on the type and its hemisphere variants, neuron types may have a page for neurons whose soma is located in the right hemisphere (), left hemisphere (), or considered to be in the middle (). If the neuron type has instances with more than one side, there is also a combined page for all neurons of that type (). Use the buttons on the left side of the page or the menu (☰) to switch between views.
The header shows the neuron type, the currently selected hemisphere variant as well as well as any associated synonyms.
Clicking on the link icon will take you to the relevant neurons' page in the neuPrint database for further exploration.
The summary section provides key quantitative information:
The number of individual neurons of this type in the dataset. For bilateral neurons, counts and ratios may be shown across hemispheres.
Combined pre-synaptic (outputs) and post-synaptic (inputs), with breakdowns where applicable. For combined pages the breakdown shows the number of neurons assigned to each hemisphere. Whereas for unilateral pages the breakdown shows the number of pre and post synapses across all neurons of the type.
Average number of synapses per neuron of this type. Useful for comparing connectivity levels. For the combined page, the breakdown shows the mean number of synapses for neurons on the right and left. Whereas for unilateral pages the breakdown shows the mean number of pre and post synapses per neuron assigned to that side.
Log ratios (ld, base 2) indicate balance across hemispheres and inputs/outputs; values below 0 favor right/inputs and values above 0 favor left/outputs.
Predicted neurotransmitter for the type and the corresponding confidence level (CL). For some types, the predicted neurotransmitter may be "Unc" for unclear.
Detailed analysis of neuron distribution across layers in visual system neuropils:
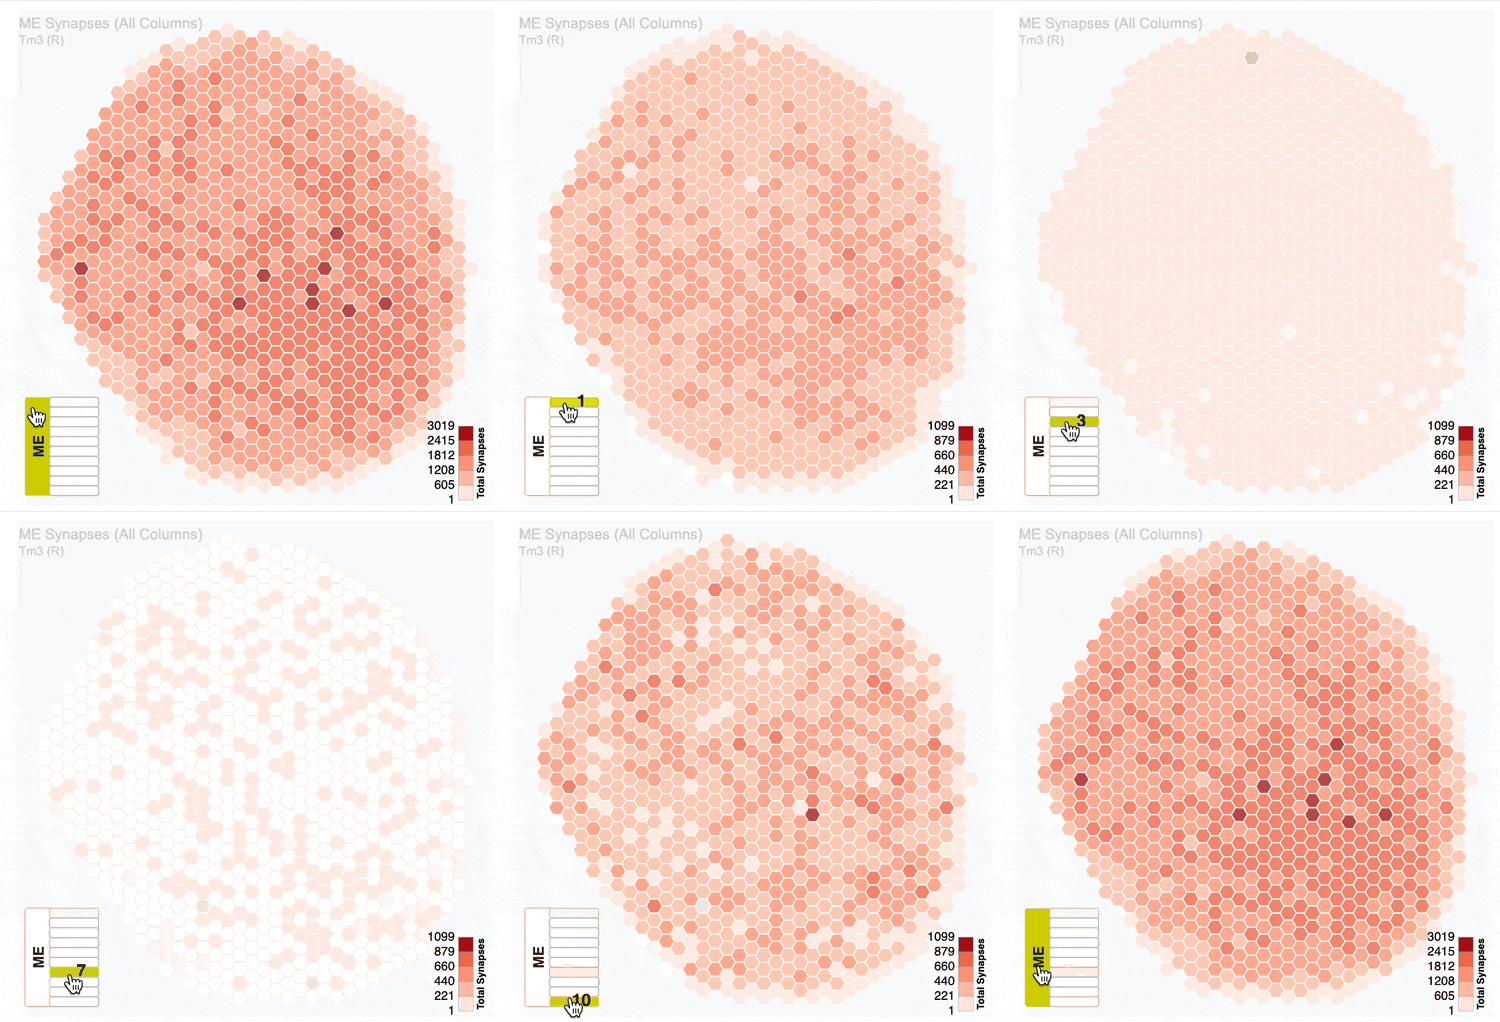
Interactive hexagonal grids show the spatial distribution of neuron terminals across columnar structure of visual system regions.
The plots show the neural innervation of the ipsilateral medulla (ME), lobula (LO) and lobula plate (LOP).
Interactive 3D visualization of neuron morphology:
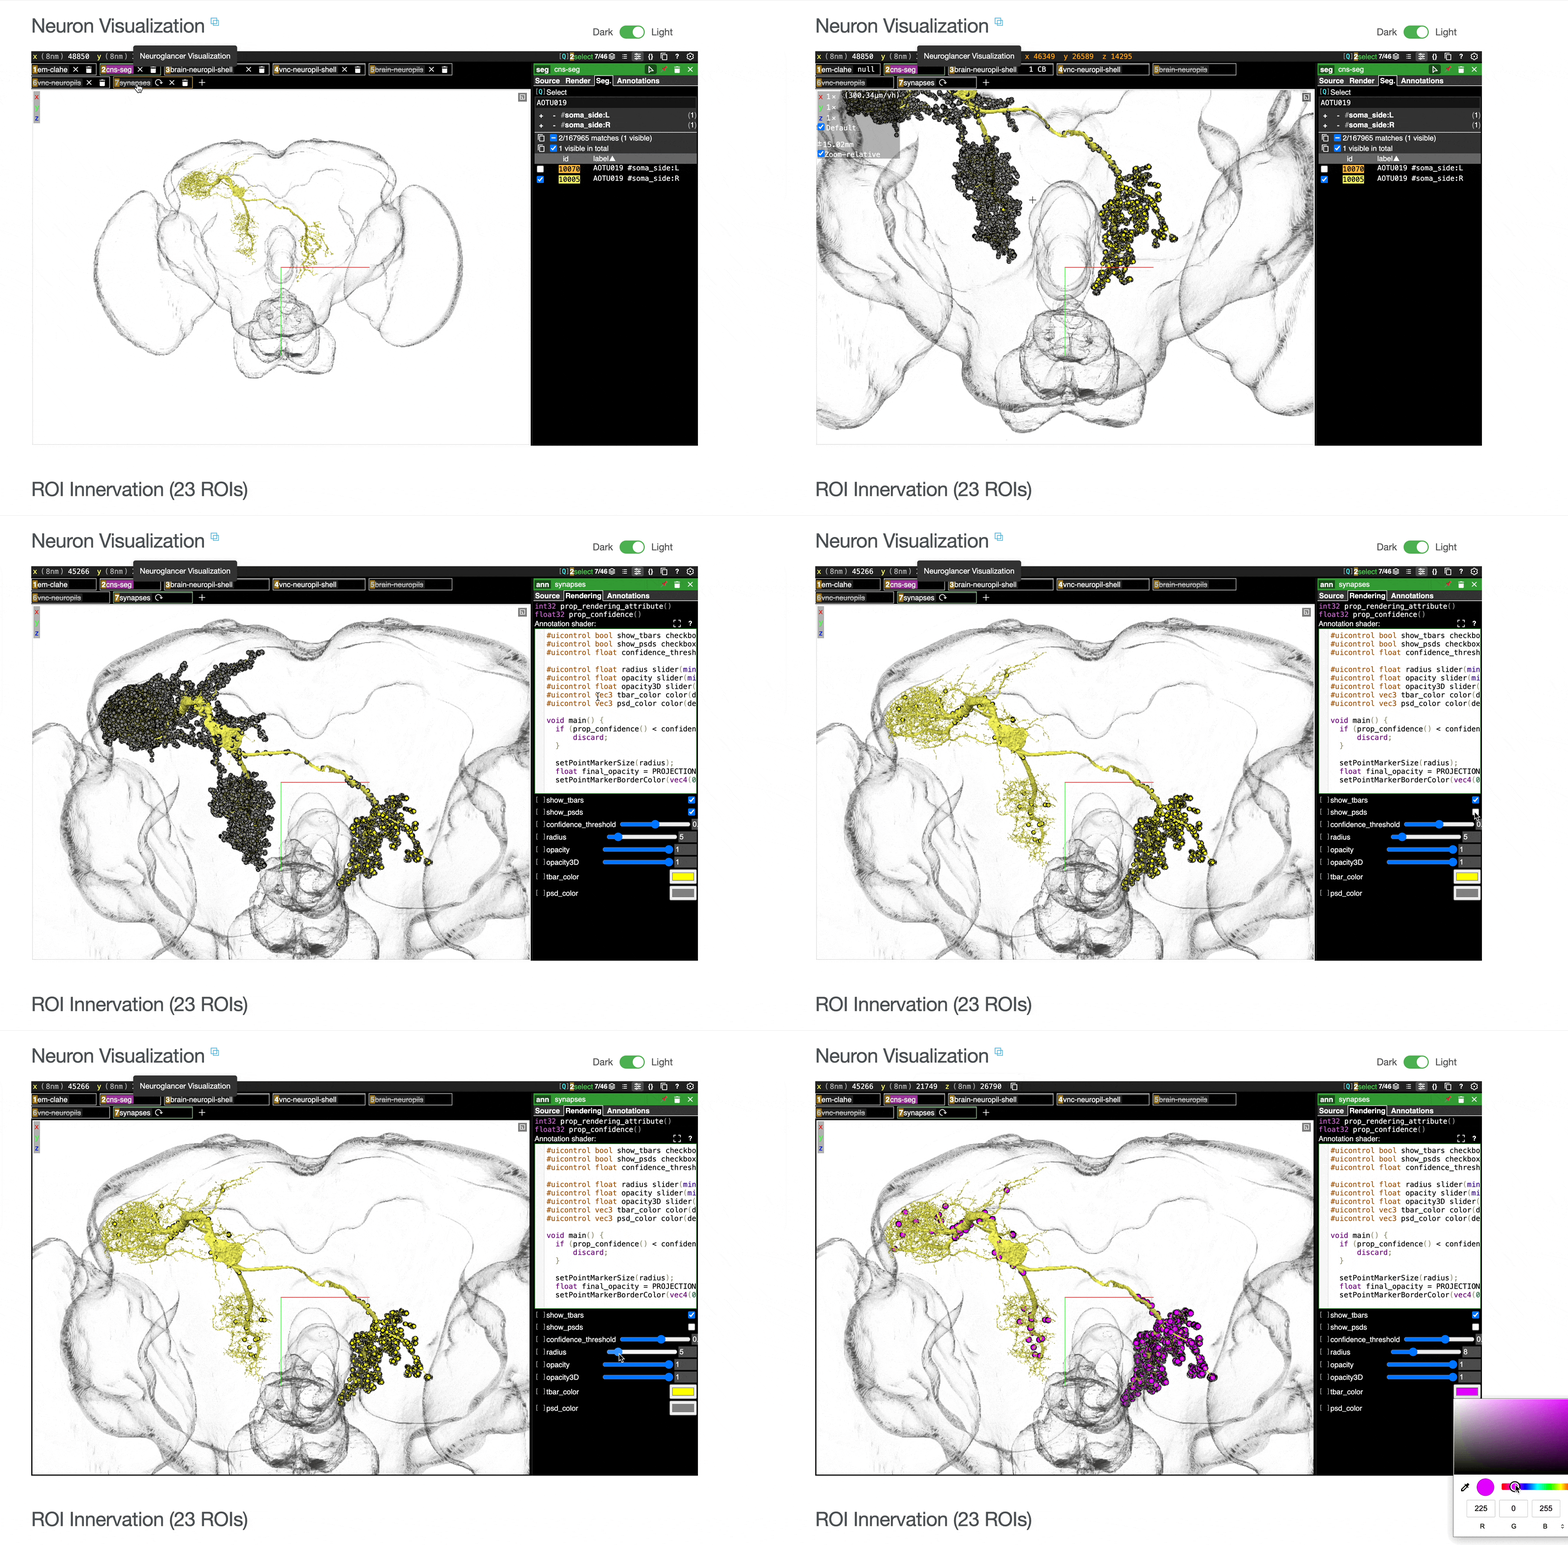
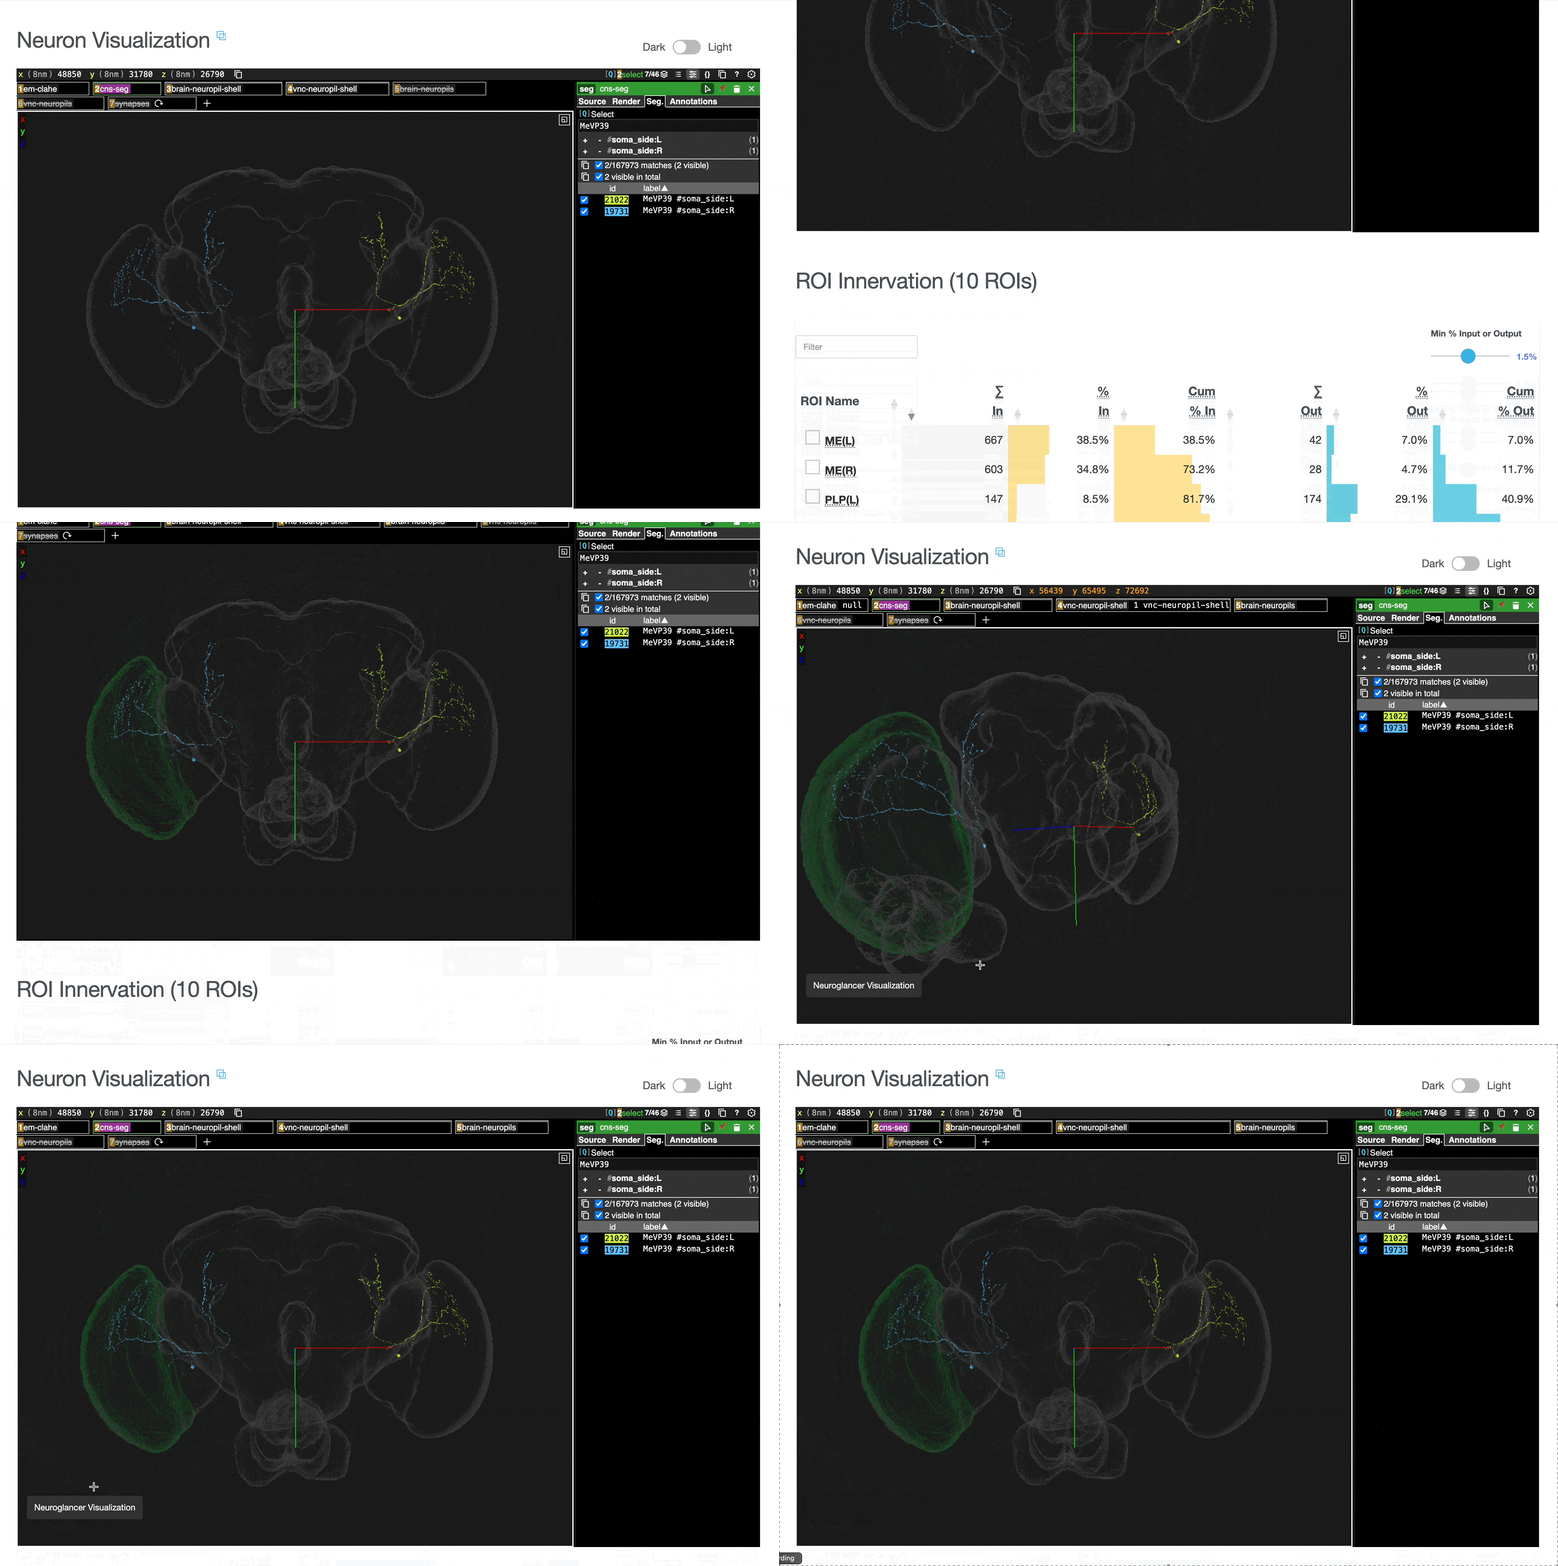
ROI meshes can be added to the neuroglancer view by selecting the blue checkbox within the ROI table. ROIs without checkboxes represent the few VNC ROIs that are currently unavailable to view within neuroglancer.
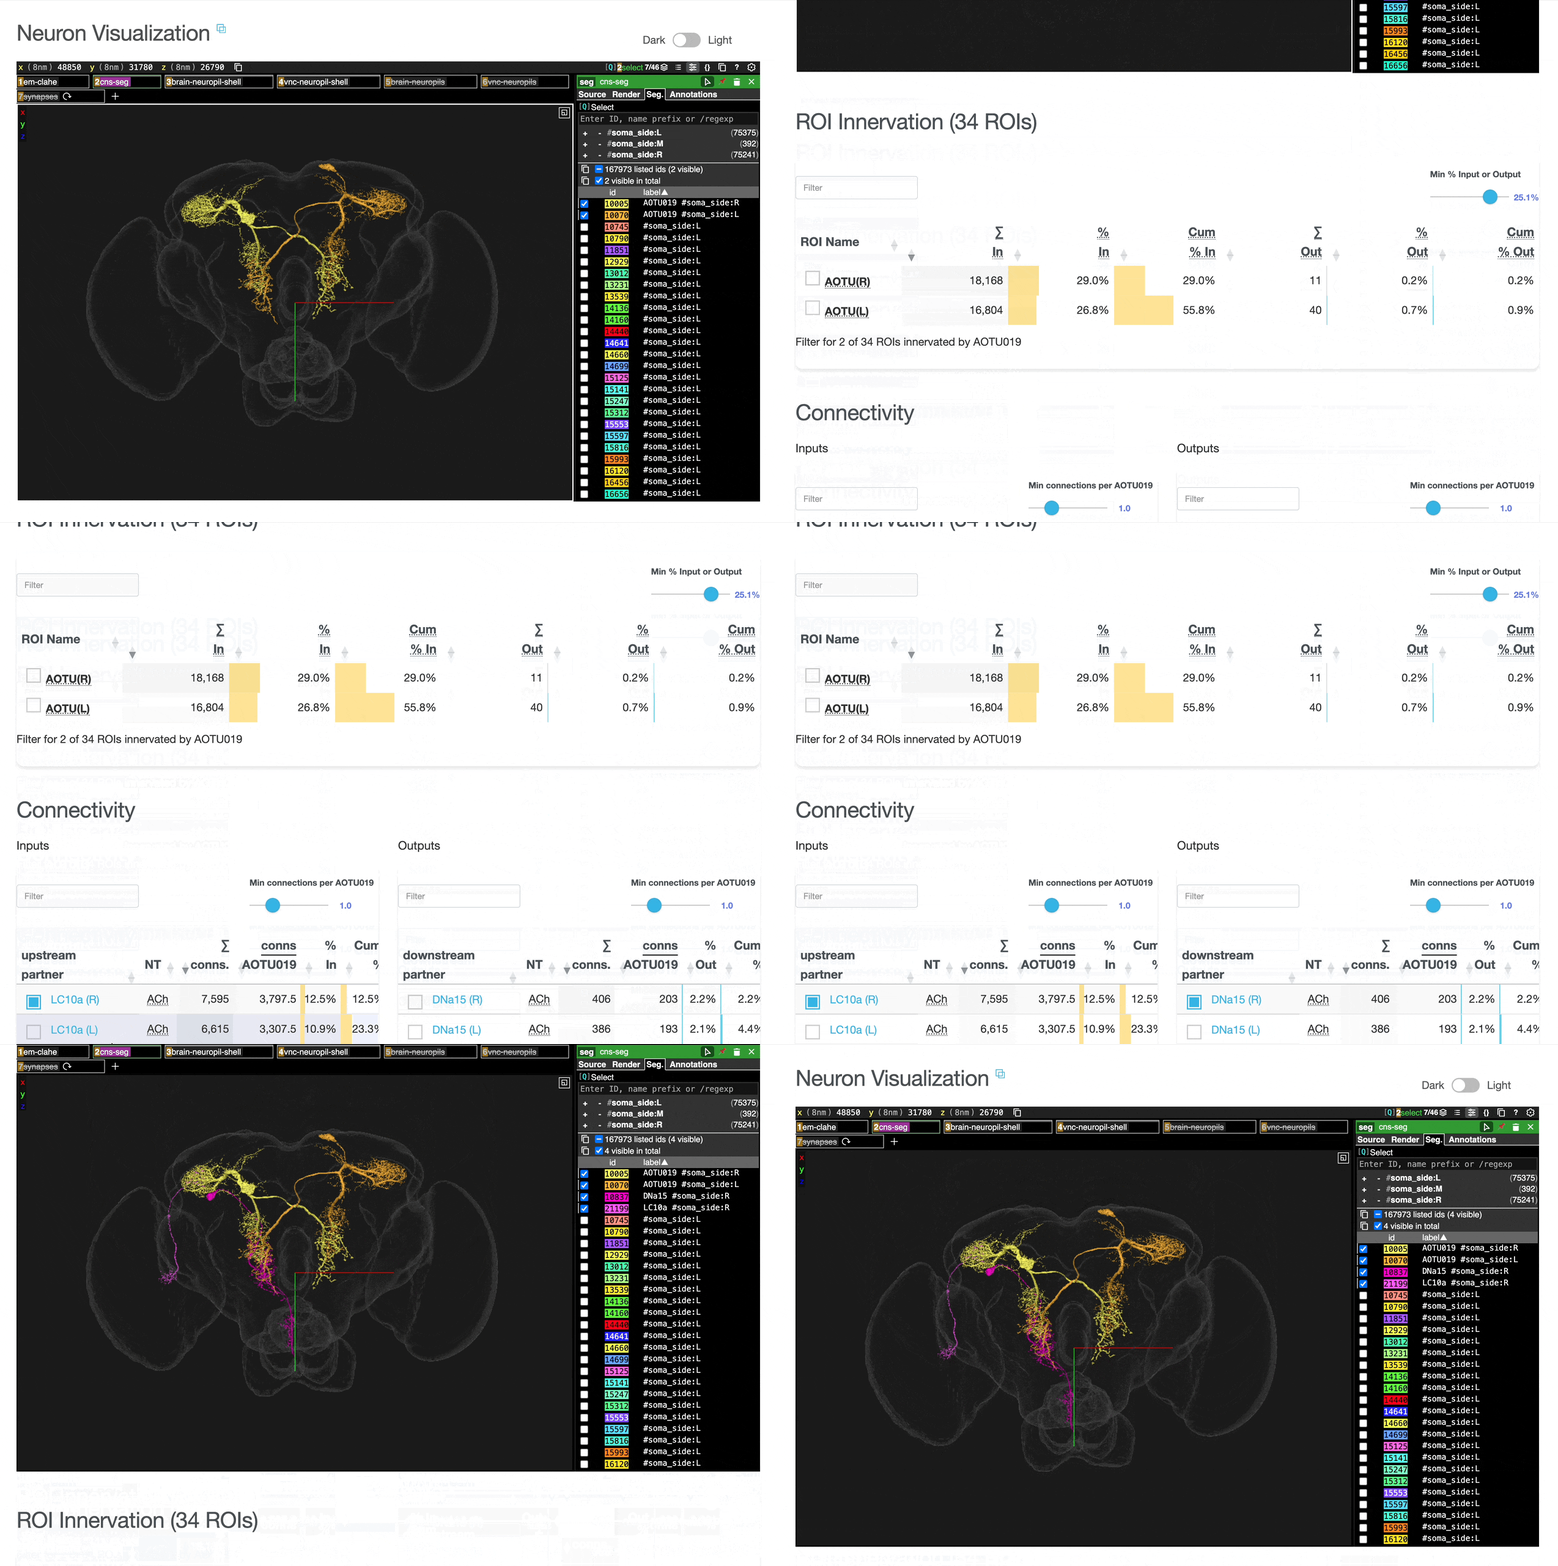
You can add connected partners to the 3D view directly from the Connectivity tables by selecting their blue checkboxes (see Connectivity Data). Some connected cell types have filled pink checkboxes because there are no neurons of that type that directly innervate the example neuron visible by default in the neuroglancer view. A random neuron of that type can be added by searching for the type in the search box within the neuroglancer view and adding it manually.
Direct link to view the same neurons in the full neuPrint interface for advanced analysis is provided on the page.
Detailed breakdown of connectivity within specific brain regions:
Comprehensive analysis of synaptic connections with other neuron types:
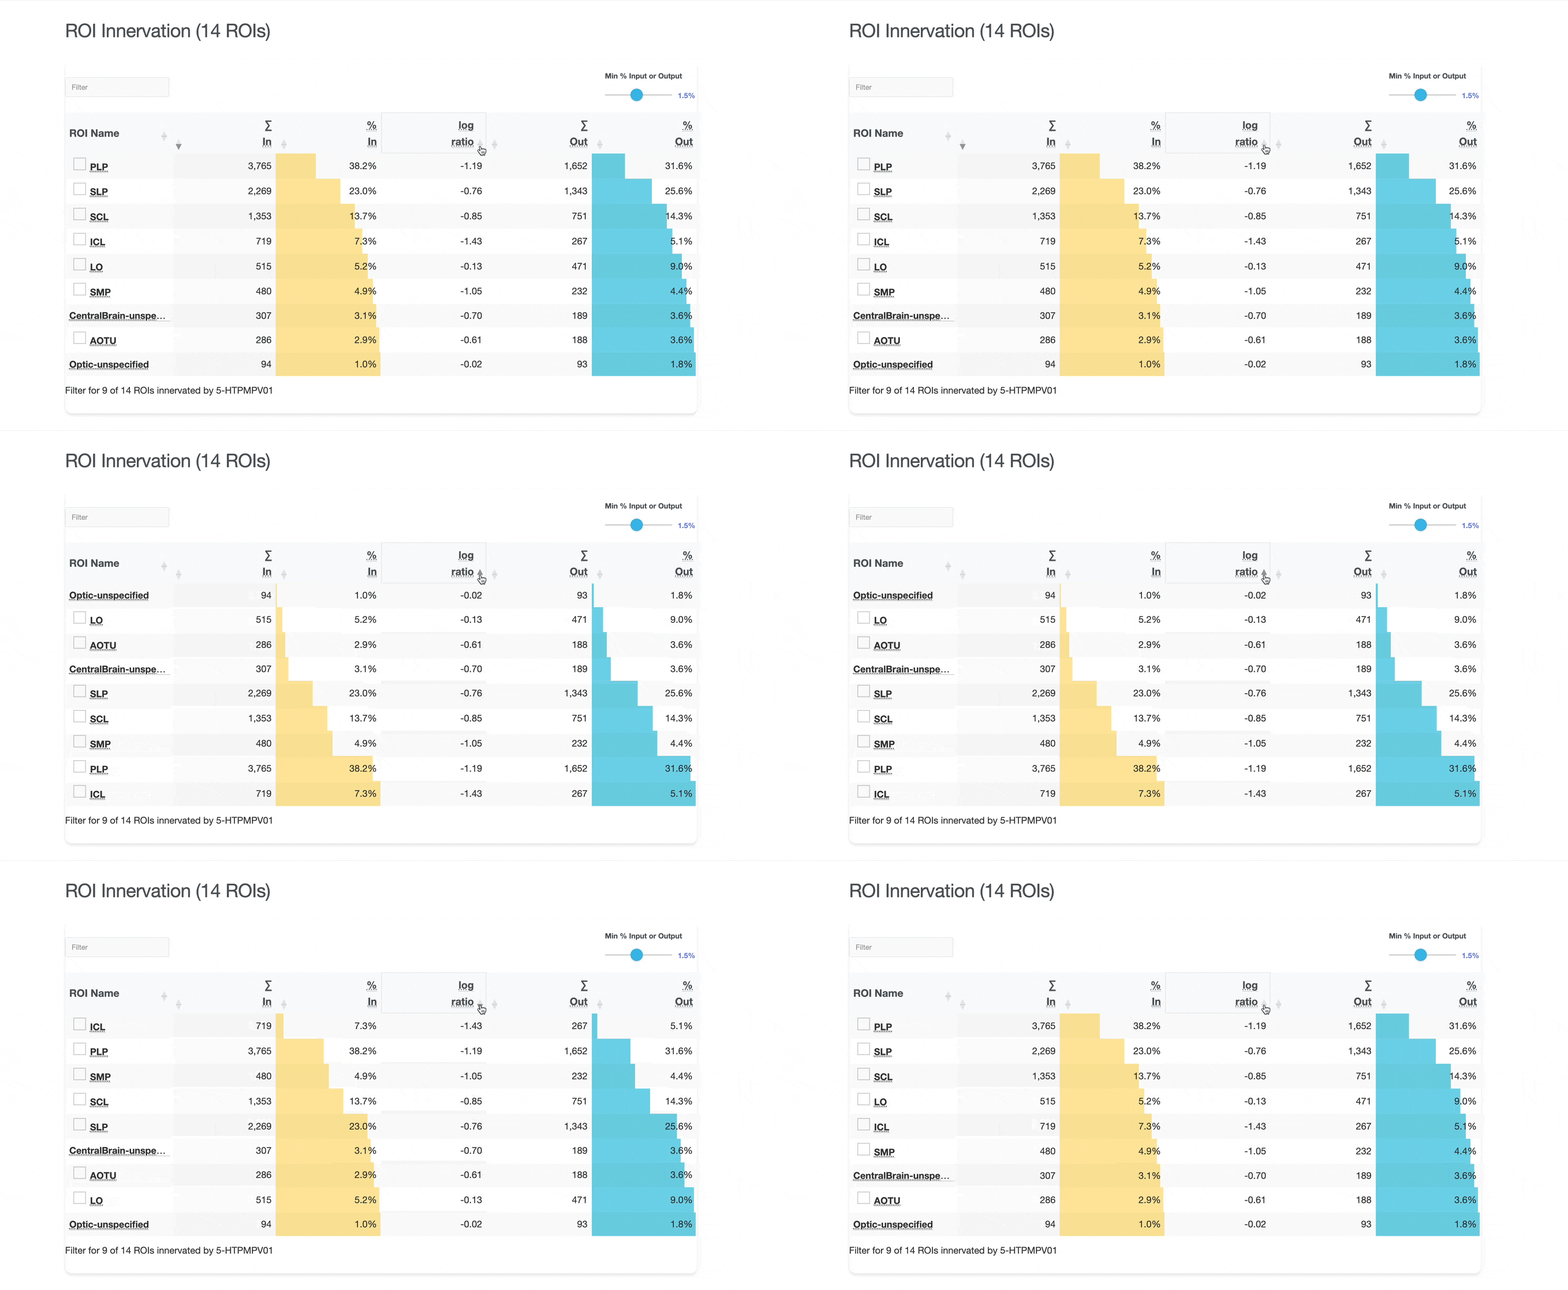
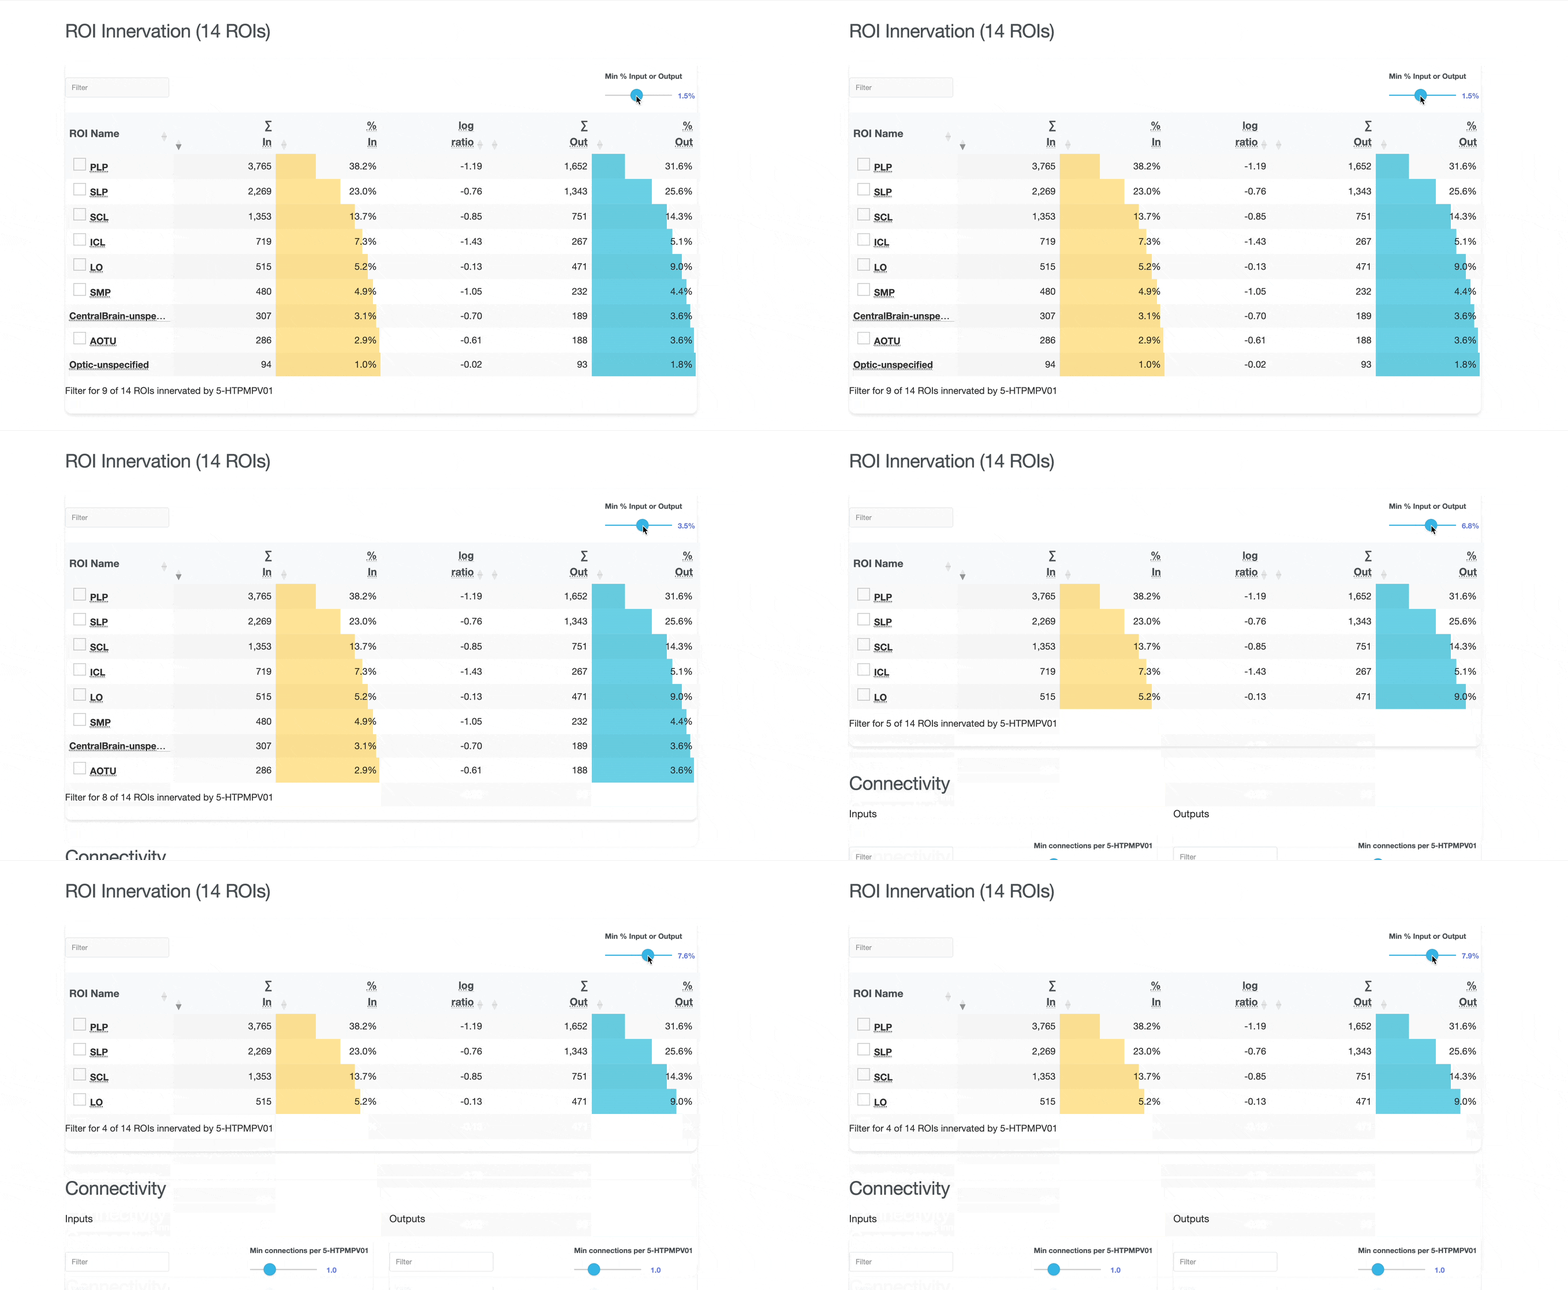
Both the ROI and Connectivity tables have a number of interactive features:
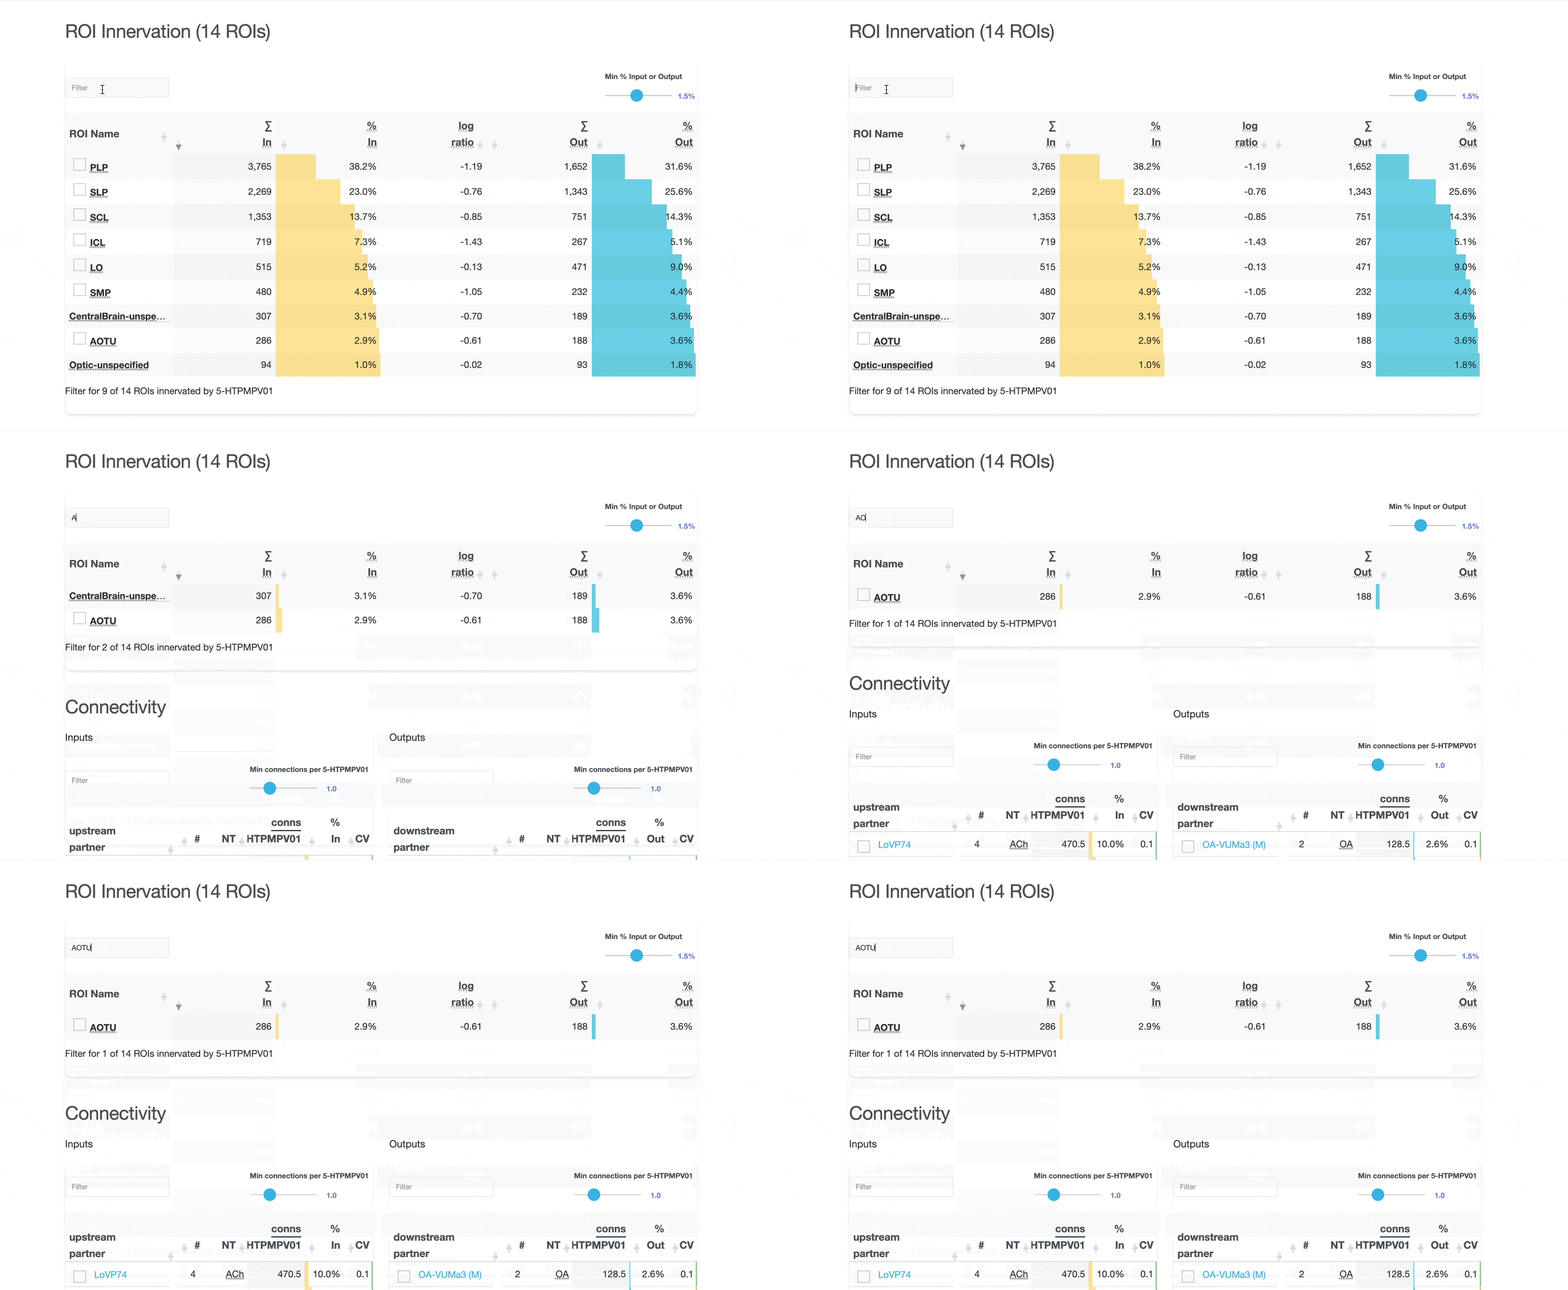
Use these checkboxes to quickly visualize specific partners together with the current neuron in 3D. Disabled checkboxes prevent redundant visualization of the same neuron instances.
Key terms and concepts used throughout the catalog:
Found an issue or have a suggestion? Please open an issue on the project repository.
Need More Help? Visit the neuPrint database for advanced analysis tools, or check the project repository for additional resources and documentation. for technical documentation.